Emily's pages: Questions · Thermal-transition test results · Studies reproduced · Experiment proposal
For the (100) silicon sample oxidized at 1000 °C for 8 h and annealed at 400 °C for 30 min, the current model is sensitive to the assumed transitions. Fast versus slow oxidation cooling changes predicted Qf by 1.669 × 10¹¹ cm⁻², exceeding the supplied paper-spread comparison of ±0.1 × 10¹¹ cm⁻². Oxide thickness changes by only 0.011 nm. The PMA ramp assumptions also change predicted Dit, but that response uses a hydrogen rate with no temperature dependence and needs physical validation.
These are simulation results, not new measurements. No model parameters were fitted for this test. The paper gives no ramp or cooling data; the transition assumptions and their sources are listed below.
Four-run comparison
The 1000 °C / 28,800 s oxidation and 400 °C / 1,800 s PMA are unchanged and TIMING stated. Every transition is TIMING assumed. The original <5 s pull is recorded as a source bound from the non-cleanroom set; applying it to this cleanroom case is assumed. Clean, load, store, metal and CV are at 25 °C.
Representative A: 3 min N₂ heatup, 3 min forming-gas PMA heatup, 10 min forming-gas cooldown. Representative B: 90 min N₂ heatup, 30 min forming-gas PMA heatup, 60 min forming-gas cooldown. Both use 5 s travel followed by the prompt's 300 s or 1,500 s O₂ cooling curve. Forming gas remains on throughout the PMA ramps and hold.
| Scenario | Oxidation cooling | Oxide (nm) | Qf (10¹¹ cm⁻²) | Dit (cm⁻² eV⁻¹) |
|---|---|---|---|---|
| A | fast | 209.168033 | 2.688796 | 1.42537e+10 |
| A | slow | 209.179042 | 4.357920 | 1.42536e+10 |
| B | fast | 209.168033 | 2.688796 | 1.97152e+09 |
| B | slow | 209.179042 | 4.357920 | 1.9715e+09 |
The four-run Qf span is 1.669124 × 10¹¹ cm⁻². Against the supplied ±0.1 × 10¹¹ cm⁻² spread, Qf is sensitive to these transitions in this model.
| Output | Four-run span | Minimum over 32 duration-corner runs | Maximum over 32 duration-corner runs |
|---|---|---|---|
| oxide_nm | 0.0110089 | 209.168 | 209.179 |
| Qf_cm2 | 1.66912e+11 | 2.6888e+11 | 4.35792e+11 |
| Dit_cm2_eV | 1.22822e+10 | 7.05604e+08 | 1.70643e+10 |
PMA-only comparison
Same oxidized wafer in both rows: A heatup and fast O₂ cooldown. Only the PMA ramps differ.
| PMA | Dit (cm⁻² eV⁻¹) |
|---|---|
| A | 1.42537e+10 |
| B | 1.97418e+09 |
Provenance
| Number or choice | Source | Timing |
|---|---|---|
| (100); 1000 C for 8 h | paper; Vitkavage 1990, Table I, PDF p. 37 | stated |
| 400 C for 30 min in forming gas | paper; PDF p. 7 | stated |
| forming gas: 10% H2 / 90% N2 | paper plus transfer assumption; PDF p. 7, explicitly specified for non-cleanroom set; adopted for cleanroom | assumed |
| pull shorter than 5 s in oxidizing gas | paper; PDF p. 6, non-cleanroom set only | bound |
| 5 s travel at 1000 C, dry O2, applied to this cleanroom case | prompt plus modelling assumption | assumed |
| 25 C at clean/load/store/metal/CV; N2 throughout preheat; dry O2 begins with the full 8 h clock | prompt | assumed |
| A: preheat 1–5 min; PMA heatup 1–5 min; PMA cooldown 5–15 min | prompt | assumed |
| B: preheat 60–120 min; PMA heatup 20–40 min; PMA cooldown 30–90 min | prompt | assumed |
| fast cooling knots 0,1.5,4.7,13,41,90,300 s at 1000,800,600,400,200,100,25 C; slow times x5 | prompt | assumed |
| emissivity 0.7; wafer thickness 525 um; density 2330 kg/m3; heat capacity 900 J/kg/K; surroundings 25 C | prompt | assumed |
| representative durations are range midpoints; hot-push curves use a normalized exponential, tau = duration/5, approximated by 12 linear segments; A PMA cooldown uses the same shape | implementation choices within prompt ranges | assumed |
| Qf comparison threshold +/-0.1e11 cm^-2 | prompt, referencing the paper's 1000 C spread; Table III prints a spread for the 1 h temperature-series row; Table VI's 8 h row has no individual spread | comparison threshold |
Radiative-equation check
The four histories use the prompt's knots exactly. Their final 25 C endpoint is an assumed tail, not the exact radiative solution (about 38.1 C at 300 s). The equation approaches 25 C asymptotically. Slow cooling is the prompt's phenomenological 5x time scaling.
Interpretation limits
- No transition temperatures or durations were fitted to measurements.
- Qf starts at the oxidation equilibrium: preheat and forming-gas steps are omitted by its existing model, so their insensitivity is built in.
- Dit uses the current fitted hydrogen rate without temperature dependence. Its changes during long forming-gas ramps are model sensitivity, not validated physical kinetics.
- The growth model retains its existing 23 nm Deal–Grove intercept; this is not a measured starting oxide. No material parameter was changed.
- The paper's 8 h Table VI/VII rows do not give individual spreads; the Qf threshold comes from the prompt and the 1000 C temperature-series spread.
- The 32 endpoint combinations sample the specified duration ranges; they are not a proof of extrema over every possible trajectory.
Temperature histories and downloadable results
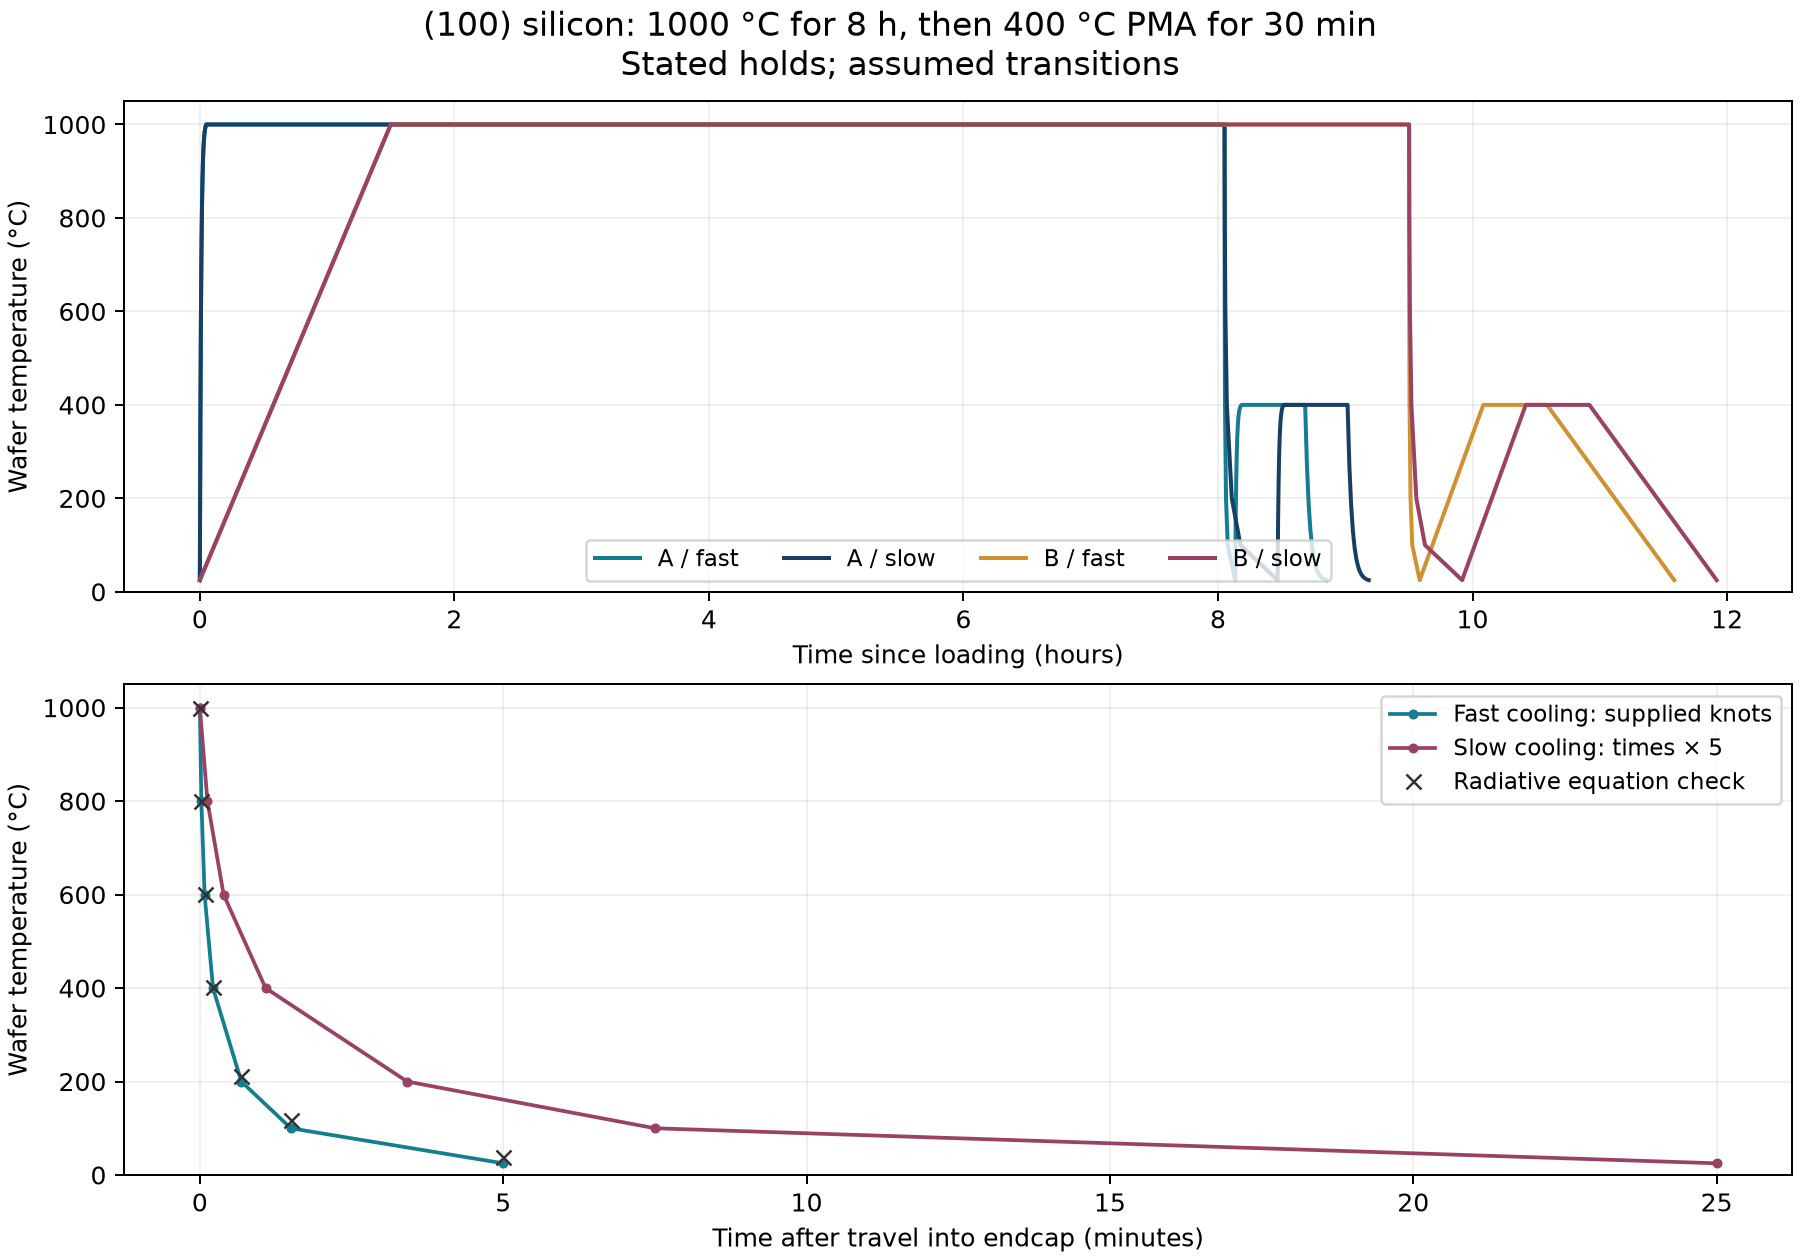
Full numerical results and assumptions (JSON) · Temperature plot (SVG)
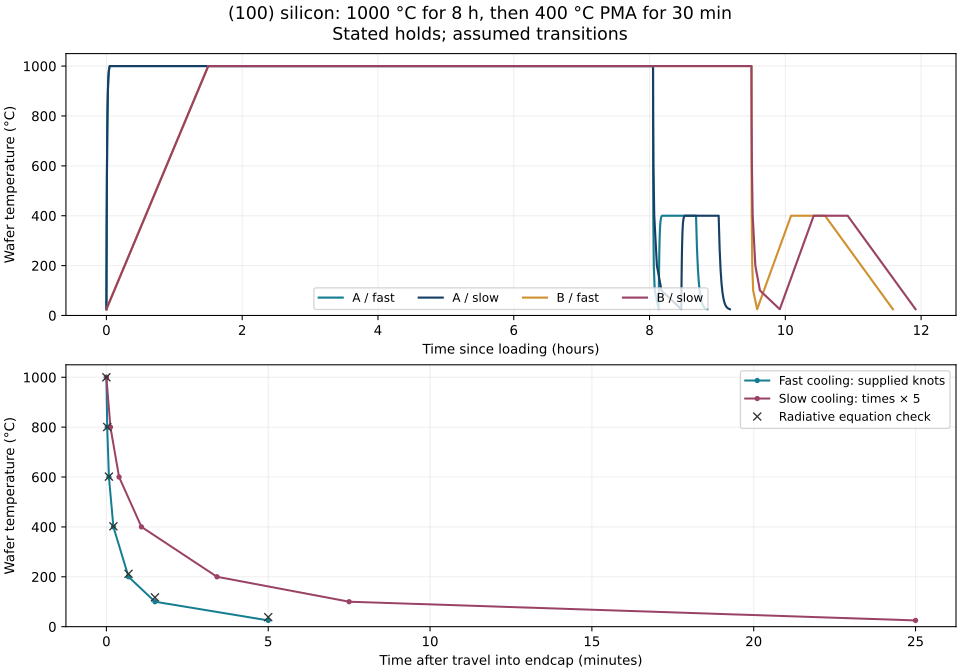
Process histories with timing labels: A, fast cooling · A, slow cooling · B, fast cooling · B, slow cooling.
The report was generated with python -m scripts.analyse_vitkavage_transitions --plot. For the underlying paper and reproduced study, see Vitkavage 1990.